

NYC Expands Speed Camera and Automated Enforcement in 2026
A Major Shift in How Speeding Is Enforced
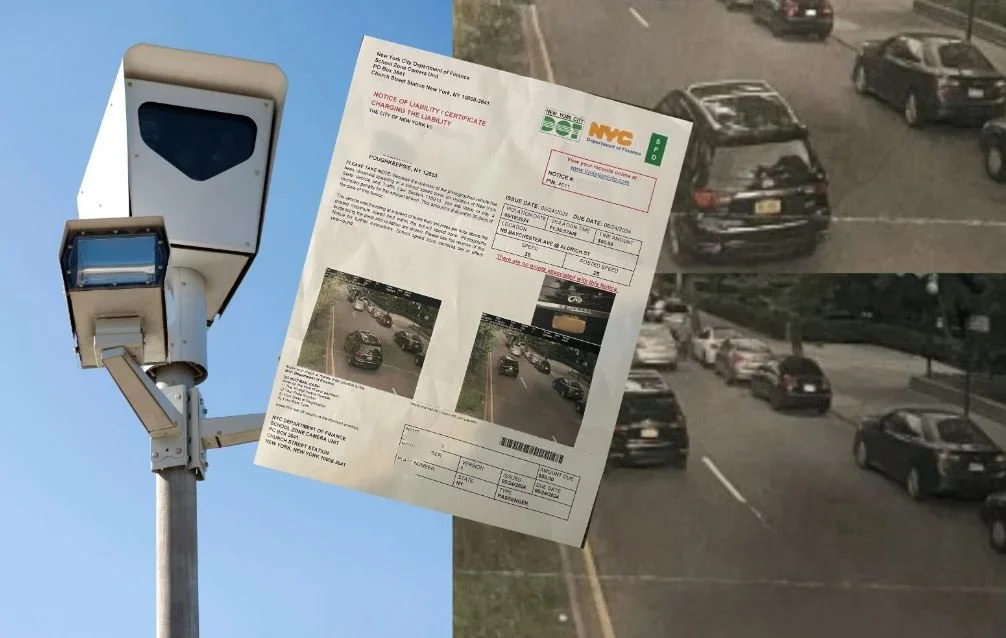
New York City has significantly expanded its automated speed enforcement system, marking one of the most aggressive traffic safety pushes in the country. Under programs administered by the New York City Department of Transportation (NYC DOT), speed cameras now operate with broader hours, wider geographic coverage, and more consistent enforcement.
For commercial drivers and fleet operators — especially those running high-frequency local routes in Brooklyn, Queens, and the Bronx — the changes are reshaping daily risk and operating costs.
24/7 School Zone Camera Operations
Previously limited to school hours, speed cameras in designated school zones now operate 24 hours a day, seven days a week.
What this means:
No more “safe hours” outside of school dismissal times
Weekend and overnight enforcement applies
Tickets are issued automatically if a vehicle exceeds the limit by more than 10 mph
For trucking companies operating early-morning container drayage or overnight grocery distribution, this is a major operational shift.
Increased Camera Density Across Boroughs
The city has expanded camera placements across all five boroughs:
Brooklyn and Queens have seen substantial increases
High-collision corridors receive additional monitoring
Arterial roads with truck traffic are now more heavily enforced
According to city officials, the goal is reducing traffic fatalities under the Vision Zero initiative.
The policy direction is clear: automated enforcement is permanent and expanding.
Escalating Penalties for Repeat Violators
Speed camera tickets in NYC are civil violations tied to the vehicle plate, not the driver’s CDL. However, repeat violations can create serious consequences:
Increased insurance premiums
Internal fleet disciplinary actions
Potential fleet safety score impacts
While these tickets do not add points to a CDL license, high violation frequency can affect underwriting reviews by insurance carriers.
For fleet operators with multiple tractors registered under one entity, repeat violations may signal systemic driver training gaps.
Bus Lane and Red-Light Camera Expansion
Speed enforcement is part of a broader automated enforcement expansion. NYC has increased:
Bus lane camera coverage
Red-light camera corridors
Automated lane violation detection
For trucks making tight urban deliveries, especially in Manhattan and Downtown Brooklyn, improper lane usage now carries higher financial risk.
Operational Impact on Trucking Companies
For NY/NJ-based carriers, especially those serving:
Retail distribution
Food service
Port drayage
Construction sites
Speed enforcement has become a cost-control and compliance issue.
Key Impacts:
Higher monthly ticket exposure
Increased insurance scrutiny
Driver training requirements
Need for route planning adjustments
Some fleets are now:
Installing real-time speed alert systems
Reviewing telematics data daily
Implementing stricter urban speed policies
Strategic Considerations for 2026
New York City’s enforcement model is unlikely to reverse. With strong political backing and measurable safety data, automated speed enforcement is becoming standard infrastructure.
For trucking companies operating in NYC:
Budget for violation risk in dense urban zones
Train drivers specifically on school zone identification
Use telematics to enforce internal speed thresholds
Review repeat violation patterns monthly
The message from city regulators is clear:
Urban freight must move slower — or pay the price.
If you'd like, I can next break down:
Estimated annual ticket exposure for a 10-truck NYC fleet
Insurance impact modeling
Or a driver policy template specifically for NYC speed compliance
Which direction would be most helpful for your operation?
NY, NJ Docks are more busy amid trade conflicts?
Port of New York-New Jersey Box Gains Shake Off Trade Reset
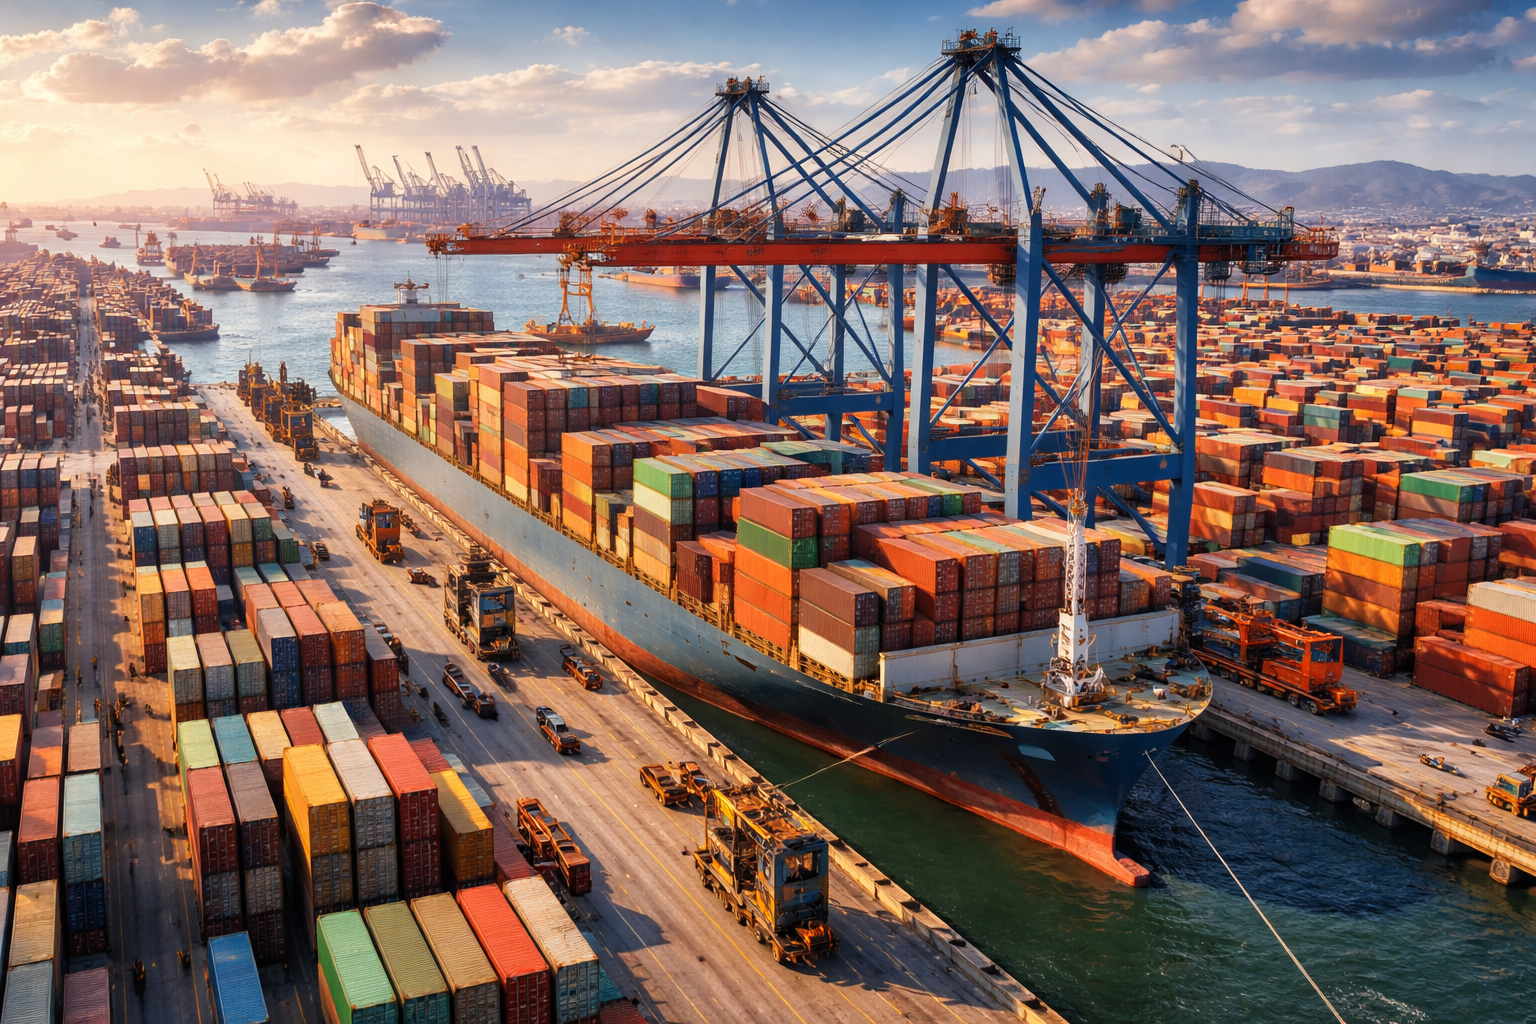
📍 The Port of New York and New Jersey — one of the largest and most important maritime gateways in the United States — has shown notable resilience amid a period of global trade reset and shifting supply-chain patterns. After years of disruption and rerouted flows, the port posted container volume gains in 2025, defying some broader trade slowdowns and signaling adaptability in an uncertain market.
What Is the Trade Reset?
Following the pandemic and subsequent geopolitical and policy shifts, global container trade has undergone a reset. This includes:
Changes in sourcing patterns — particularly reduced import volumes from China and growth from Southeast Asian economies.
Shifts in ocean freight routing — such as alternate routing to avoid geopolitical risk (e.g., diversions around the Red Sea).
Heightened trade policy uncertainty — including evolving tariff regimes and trade deals.
These shifts disrupted traditional West Coast gateways and opened opportunities for East Coast ports to attract more diversified cargo flows.
2025 Performance: Gains Amid Declining China Trade
Despite a year-on-year decline in China-origin volumes, the Port of New York-New Jersey still posted growth in loaded container traffic (measured in twenty-foot equivalent units, TEUs) in 2025. According to recent industry reporting, it was the second-busiest port in the U.S. for loaded containers last year — a strong performance given broader market challenges.
This outcome reflects:
Diversified sourcing — with Southeast Asia and other regions gaining share relative to China, helping sustain overall volumes.
Robust import demand in the northeastern U.S. — a densely populated and consumption-heavy region that supports sustained container flows.
Port efficiency gains — including congestion-free berths, secure container operations, and effective rail connections that reduce dwell times and speed inland distribution.
Why It Matters: East Coast Competitive Dynamics
The port’s gains are particularly noteworthy in the context of shifting U.S. import patterns. Historically:
West Coast ports (e.g., Los Angeles and Long Beach) handled the majority of trans-Pacific trade.
East and Gulf Coast gateways have been steadily gaining share as supply chains diversify and shippers seek alternatives to Pacific congestion.
The performance of the Port of New York-New Jersey suggests that this trade reset isn’t purely disruptive — it’s also redistributive. Shippers are increasingly balancing route choices, and strong infrastructure on the East Coast is helping capture that redistributed volume.
Broader Market Signals
National import trends in early 2026 show a rebound in U.S. container imports after seasonal dips, with several major gateways — including New York/New Jersey — posting month-to-month increases.
China volumes, while still below peak levels, regained some month-over-month share in early 2026, hinting at stabilization in trade flows.
Geopolitical and policy forces continue to shape overall trade — including evolving tariff regimes and transatlantic negotiations — underscoring that ports must remain agile to adapt.
Looking Ahead
For 2026 and beyond, the port’s continued success will likely depend on:
Sustaining diversified import flows that reduce heavy reliance on any single trade lane.
Expanding terminal capacity, inland connectivity, and supply-chain services to handle demand efficiently.
Capitalizing on East Coast catch-up as shippers rethink global networks in favor of balanced coast-to-coast access.
If maintained, these trends could further solidify the Port of New York-New Jersey as a key competitive gateway in North American trade — one capable not just of weathering a global trade reset but profiting from it.
6 Mile Lines at NY/NJ Ports
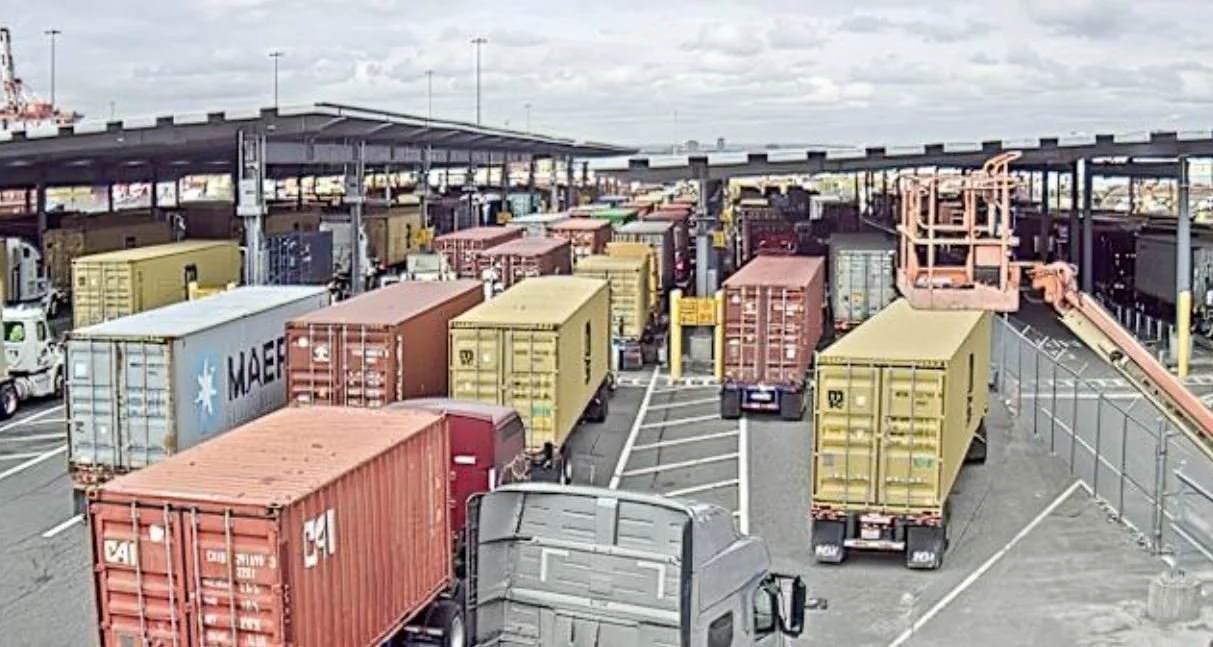
The Port Authority of New York and New Jersey is facing renewed congestion pressure as truck lines stretch up to six miles outside key marine terminals in Newark and Elizabeth. Drivers report wait times exceeding four to six hours during peak pickup windows, creating ripple effects across warehouses, highways, and regional distribution hubs.
Industry sources say the backlog is being fueled by a combination of vessel bunching, chassis shortages, labor bottlenecks, and winter weather disruptions.
What’s Causing the Backup?
1. Vessel Bunching and Import Surges
After weeks of delayed arrivals due to weather and global routing shifts, multiple vessels have discharged containers within narrow time windows. This creates a surge effect—thousands of containers become available simultaneously, overwhelming gate capacity.
2. Chassis and Yard Congestion
Limited chassis availability and slow turn times prevent containers from moving quickly out of terminals. When yard utilization climbs above 80–85%, productivity drops sharply. At several terminals near Port Newark and Port Elizabeth, container stacks have reached near-capacity levels.
3. Labor and Appointment Bottlenecks
Even with extended gate hours, appointment systems become saturated during heavy volume weeks. Truckers often report securing a time slot but still waiting hours after arrival due to equipment imbalances or container rehandles.
4. Weather Impact
Recent winter storms in the Northeast disrupted rail departures and slowed yard operations, compounding existing delays. Snow accumulation reduces terminal mobility and slows crane productivity.
Impact on Trucking Companies
For drayage carriers operating in New Jersey and New York, the impact is immediate:
Fuel Waste: Idling for 3–6 hours significantly increases operating costs.
Driver Hours-of-Service Pressure: Under FMCSA rules, long gate waits eat into the 14-hour work window.
Reduced Daily Turns: Instead of completing 2–3 port turns per day, many drivers are limited to just one.
For small and mid-sized carriers, congestion directly reduces revenue per truck per day while fixed costs—insurance, truck payments, IFTA fuel taxes—remain unchanged.
Broader Supply Chain Effects
The congestion extends beyond the port gates:
Warehouses in Northern New Jersey face delayed inbound inventory.
Rail connections experience slower container transfers.
Retail replenishment timelines tighten ahead of seasonal demand.
The Port of New York and New Jersey remains one of the busiest gateways on the East Coast. When congestion escalates here, the entire Northeast corridor—from Pennsylvania distribution centers to New England retailers—feels the impact.
What’s Being Done?
Port officials are monitoring yard density and encouraging off-peak pickups. Some terminals have implemented:
Extended gate hours
Incentives for nighttime drayage
Temporary storage fee adjustments
Industry groups are also urging better chassis pool coordination and improved real-time data sharing between terminals and trucking companies.
Outlook
While congestion spikes are not uncommon during high-volume periods, sustained six-mile truck queues signal structural strain. If vessel bunching continues and yard density remains elevated, delays could persist for several weeks.
For carriers and logistics operators, proactive scheduling, flexible warehouse receiving hours, and real-time dispatch adjustments will be critical in navigating the current gridlock.
As global supply chains continue adjusting to shifting trade flows and weather disruptions, the NY/NJ port complex remains both a vital economic engine—and a pressure point for the entire region.
Melt, refreeze, and “urban ice”
Snow piles are more than messy—they’re lane closures
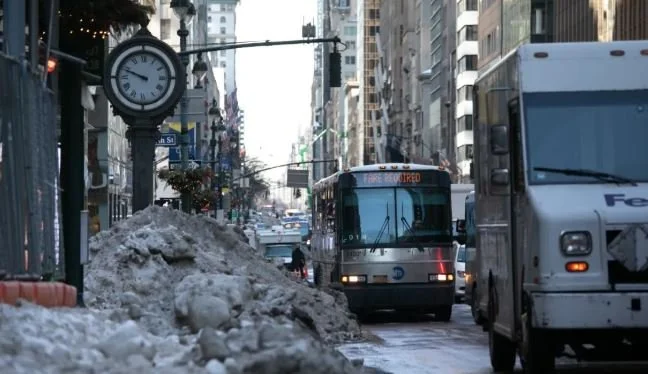
A big storm doesn’t just leave snow; it leaves stored snow. In dense neighborhoods, that “storage” is the street edge: curb lanes, corners, medians, and occasionally entire parking lanes. Each snow pile:
Narrows the roadway (often turning two functional lanes into one)
Eliminates curbside loading (forcing double-parking or longer walks with carts)
Creates blind corners for turning vehicles and pedestrians
Blocks drains, leading to meltwater refreeze and persistent black ice
In Manhattan, downtown Jersey City, Hoboken, Newark, and many inner-ring suburbs, that narrowing effect is immediate because there’s no spare right-of-way. The street grid may look the same on a map, but its real capacity drops sharply.
Bus service takes an early hit—and recovers slowly
Buses are “surface transit,” meaning they share the same constrained lanes as everyone else. Snow piles tend to break bus reliability in specific ways:
Bus stops become unusable if the curb is walled off—riders wait in the street or buses skip stops.
Dwell times increase as passengers board from awkward angles or single-door entry becomes slower.
Bus lanes get compromised when plows push snow into them or when cars drift into them to avoid piles.
Even after the storm ends, snow piles can keep bus operations degraded for days, especially if melting/refreezing creates uneven curb edges and icy stop zones.
Curb space is the hidden battleground for freight
NYC and North Jersey run on curbside logistics: parcel vans, box trucks, food distributors, building supplies, waste hauling, service vehicles. Snow piles make curbside access scarce, and that scarcity shows up as:
More double-parking → blocked lanes → slower traffic → longer routes
Longer dwell times because drivers can’t get close to the door
Higher damage risk (scraped bumpers, torn mudflaps, curb strikes, pedestrians squeezed into travel lanes)
Rescheduled stops and “missed windows,” especially for businesses that rely on just-in-time deliveries
The economic cost is subtle but real: overtime, failed delivery attempts, and reduced daily stop counts. For perishable freight, delays can also mean product loss or quality degradation.
The “last 50 feet” becomes the hardest part
After snow, the biggest challenge often isn’t the highway—it’s the final approach:
Apartment buildings with unshoveled curb cuts
Commercial blocks where piles cover hydrants, meters, and loading zones
Warehouses and docks where yard snow restricts turning radius
Side streets where plowed berms trap vehicles in or out
In NYC’s denser areas, even if arterials are cleared, the last 50–200 feet can determine whether a delivery is safe, legal, and fast.
NJ–NYC crossings and chokepoints amplify delays
The region’s network has built-in choke points: tunnels, bridges, approaches, and major interchanges. Snow piles and storm operations (plowing, salting, staged closures) create compounding effects:
Reduced lane availability on approaches
Slower speeds from slush spray and refreeze risk
Increased incident rates (minor crashes quickly cascade into regionwide delay)
Knock-on congestion that spreads to local streets and industrial corridors
Because so much freight and commuter flow funnels through a small number of crossings, the metro area is unusually sensitive to even modest reductions in throughput.
Safety impacts: visibility, pedestrians, and secondary crashes
Snow piles change the geometry of streets:
Sightlines disappear at corners and crosswalks
Pedestrians are forced into the roadway when sidewalks and curb ramps are blocked
Cyclists lose shoulder/edge space and must merge into narrower lanes
Vehicles have reduced escape paths, so minor skids become impacts
A key point: the most dangerous time is often 24–72 hours after the storm, when piles harden, meltwater refreezes overnight, and drivers become less cautious because skies are clear.
The long tail: melt, refreeze, and “urban ice”
Snow piles don’t just vanish. They compact into dirty ice mountains that can last weeks, and they create predictable problems:
Daytime melt → nighttime refreeze along curbs and crosswalks
Blocked drains → standing water → sheet ice
Salt saturation that accelerates vehicle corrosion and degrades concrete/steel
Pothole formation as freeze-thaw cycles hammer road surfaces
This is why transportation disruptions can persist well after plows have “cleared” the streets.
What helps: practical strategies that reduce disruption
A few approaches consistently improve outcomes in NYC–NJ, especially where space is tight:
Prioritize snow removal at corners and bus stops, not just mid-block lanes (restores visibility and transit reliability).
Create and enforce temporary loading solutions (e.g., time-windowed curb access on priority commercial blocks) to reduce double-parking.
Accelerate snow haul-away in the densest districts where piles become semi-permanent.
Keep drains open during and immediately after storms to reduce refreeze hazards.
Clear curb cuts and hydrants fast to protect pedestrian routes and emergency response.
Target industrial corridors (Port Newark/Elizabeth, warehouse zones, major arterials) so freight doesn’t spill into local streets.
Bottom line
In the NYC–NJ region, snow piles function like temporary infrastructure: they reshape streets, reduce capacity, and force every mode—cars, buses, trucks, pedestrians—into tighter space. The impact isn’t limited to storm day. It lingers through the “long tail” of hard-packed piles, melt/refreeze cycles, and curbside dysfunction. Managing snow piles well is less about aesthetics and more about keeping the metro’s transportation and supply chain moving safely and predictably.
If you want, tell me the angle you want (public transit, trucking/freight, or safety/policy), and I’ll rewrite this as a tighter op-ed, a data-driven explainer, or a trucking-industry piece with cost impacts (dwell time, stops/day, CPM).
A Winter’s Wrath: How the Recent Snow Storm Impacted New York and New Jersey
In late January 2026, a powerful winter storm — often referred to as Winter Storm Fern — swept across the U.S., before hammering the New York–New Jersey Tri-State area with heavy snow, sleet, freezing rain and prolonged cold. The event was one of the most disruptive winter storms of the season, and its economic and logistical impacts are still rippling through daily life and commerce.
Historic Snowfall and Brutal Cold
The storm delivered significant snowfall across major population centers:
New York City recorded over a foot of snow in many boroughs — setting daily records and paralyzing urban traffic.
Northern New Jersey and the Hudson Valley saw double-digit accumulations, with some areas reporting more than a foot of snow.
Regional suburbs and parts of upstate New York logged even higher totals due to persistent bands of snow and lake-effect enhancements.
The snow didn’t just fall — a deep arctic air mass settled in behind it, prolonging hazardous conditions and slowing any melting or cleanup.
Travel Chaos and Transportation Disruptions
The storm brought everyday life to a near standstill:
Airports such as LaGuardia, JFK and Newark experienced widespread flight cancellations.
Public transit and rail services were suspended or severely delayed, with NJ Transit and Amtrak reporting major service interruptions.
Road travel became dangerous, leading to numerous weather-related accidents and vehicle restrictions across interstates.
These disruptions underscored how quickly severe weather can ripple through critical infrastructure, affecting not just commuters but freight and supply chains too.
School Closures and Remote Work
Across both states, many school districts shifted to remote instruction, while some employers continued remote work policies to minimize travel risk. Municipal workers and emergency crews were stretched thin as cleanup and snow removal operations extended into the following week.
Public Safety and Human Cost
The frigid conditions led to cold-related emergencies including hypothermia and vehicle accidents, particularly among vulnerable populations. Emergency shelters and Code Blue advisories were activated in major cities to protect unhoused residents. High snow piles also blocked access to hydrants and walkways, creating ongoing safety hazards.
Economic Impact (Broad Overview)
Economists warn that the storm’s disruption to travel, power grids, business operations, and supply chains could contribute to billions in economic losses nationwide. The storm’s breadth — stretching across dozens of states — magnifies both direct cleanup costs and broader ripple effects, from reduced production to delayed deliveries.
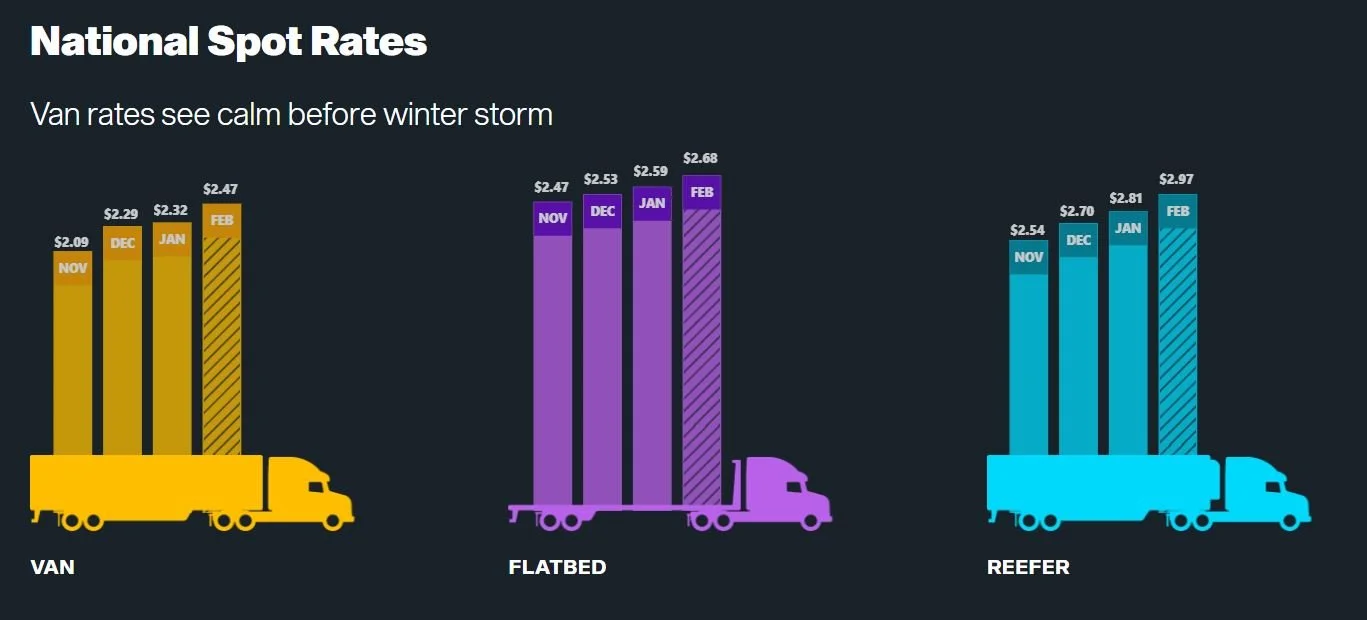
Surging Trucking Prices and Freight Impacts
Beyond the immediate effects on transit and local mobility, the storm has had a notable impact on trucking prices and freight markets, particularly in and out of the Northeast:
Tightened Capacity and Higher Rates
Severe weather has tightened trucking capacity, especially along key freight corridors that pass through or near New Jersey and New York, forcing carriers to reroute or delay runs.
In the spot freight market — where shippers book trucks on short notice — rates for dry van and refrigerated freight have jumped or remain elevated due to limited available trucks and increased demand for urgent capacity.
Rising Costs for Specialized Freight
Extreme cold and road closures have led some shippers to seek refrigerated or insulated trailers even for goods not normally requiring cold chain services, pushing rates higher on those equipment types.
Expedited services — such as dedicated or hotshot trucking — have grown in demand as businesses try to bypass backlogs and avoid downstream shortages or contractual penalties.
Additional Cost Drivers
Detours, longer routes, and idle time (deadhead miles) are increasing fuel and labor costs for carriers.
Road closures and reduced operating hours at warehouses and distribution centers are leading to detention charges and slower turnaround, which carriers often pass on to shippers.
Short-Term vs. Mid-Term Outlook
Much like prior winter disruptions, experts expect elevated freight rates to persist through the storm’s immediate aftermath as logistics networks clear backlogs and capacity normalizes. Over time, rates may stabilize, but the event highlights how extreme weather continues to create volatility in freight pricing.